Using Insight - Netflow Analyzer
OPNsense is equipped with a flexible and fast Netflow Analyzer called Insight. To use Insight, one needs to configure the Netflow exporter for local capturing of Netflow data. To do so take a look at Configure Netflow Exporter.
User Interface
Insight is a fully integrated part of OPNsense. Its User Interface is simple yet powerful. It can be accessed via .
Insight offers a full set of analysis tools, ranging from a graphical overview to a csv exporter for further analysis with your favorite spreadsheet.
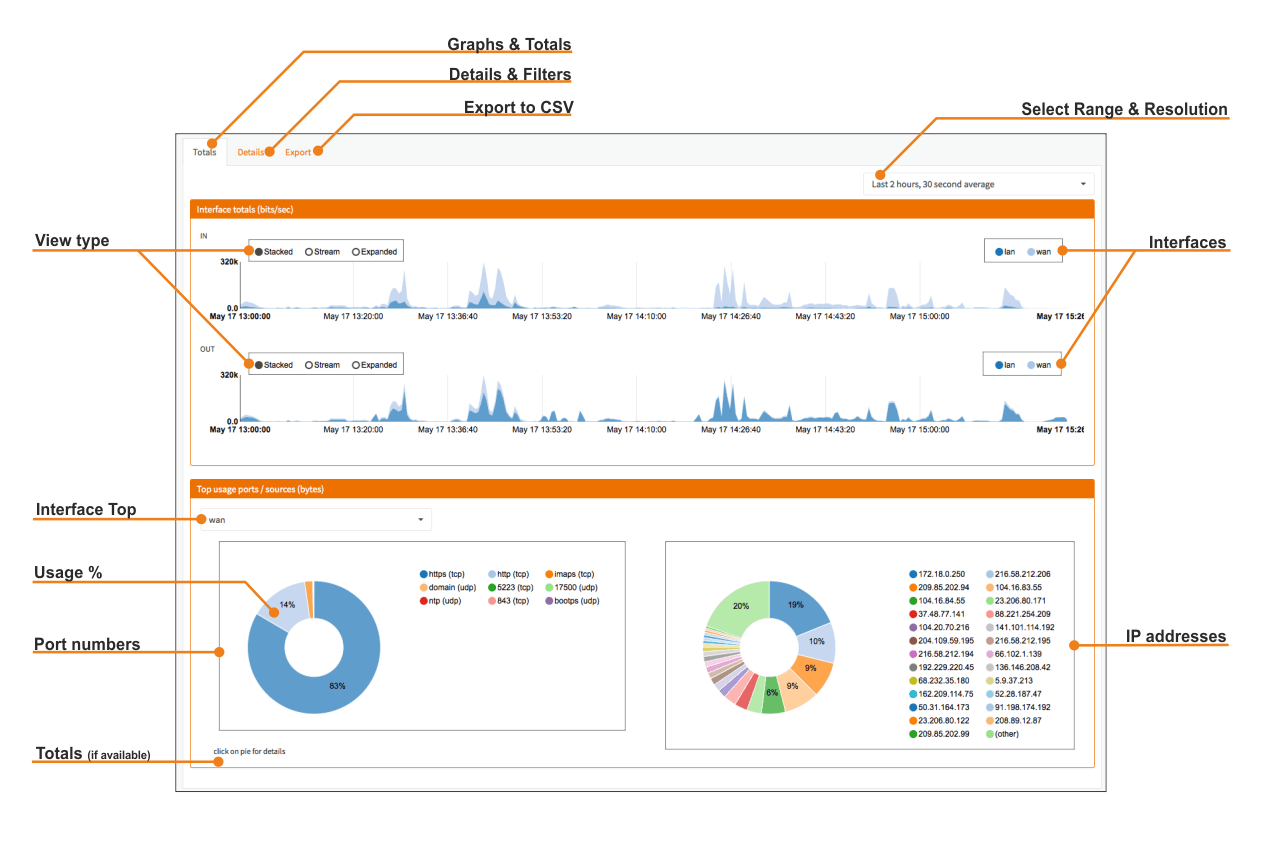
Graphs & Totals
The default view of Insight is the Top users and Graphical Overview. This view allows for quick examination of current and past flows, showing a graph for in and out going traffic for each configured interface.
Select Range & Resolution
In the top right corner a selection can be made for the date range and accuracy (resolution) of the collected traffic flows.
View Type
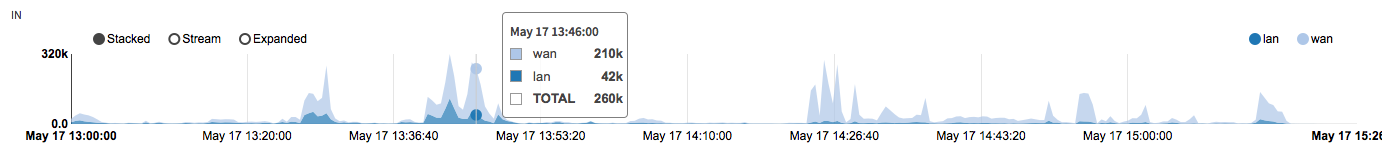
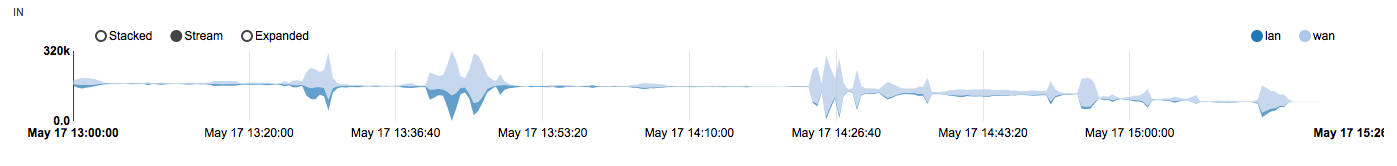
One can show the traffic flows in a stacked manner (default), as a stream or expanded to compare usage with different interfaces.
Stacked
Stream
Expanded
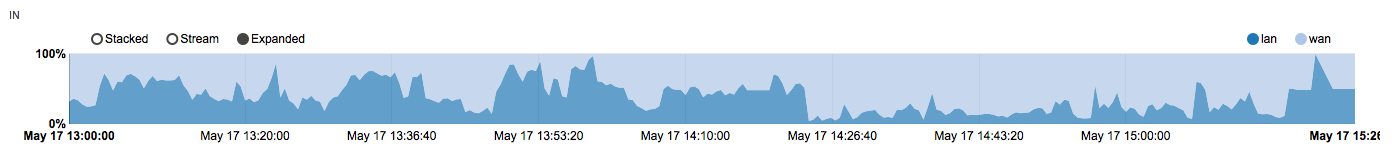
Interfaces
Clicking on an interface disables or enables the graph view, double clicking select only that interface.
Top Users
The top 25 users are shown for a selected interface, both for ports and ips within the previously selected date range.
Interface Top
Select the interface to see the top 25 users.
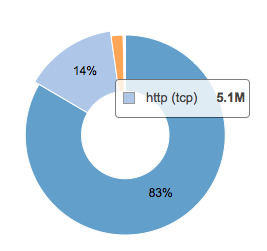
Port Pie Chart
The port pie chart shows the percentage per port/application. One can change the view by clicking or double clicking on one of the shown port names/numbers.
Clicking on a piece of the pie will open a detailed view for further analysis.
IP Addresses Pie Chart
The IP addresses pie chart works the same as the ports pie chart and shows the percentage per IP number. One can change the view by clicking or double clicking on one of the shown IP numbers.
Clicking on a piece of the pie will open a detailed view for further analysis.
Interface Totals
Not shown in the screenshot but latest version also includes a Total for the selected interface, shown are Packets (In, Out, Total) and Bytes (In, Out, Total).
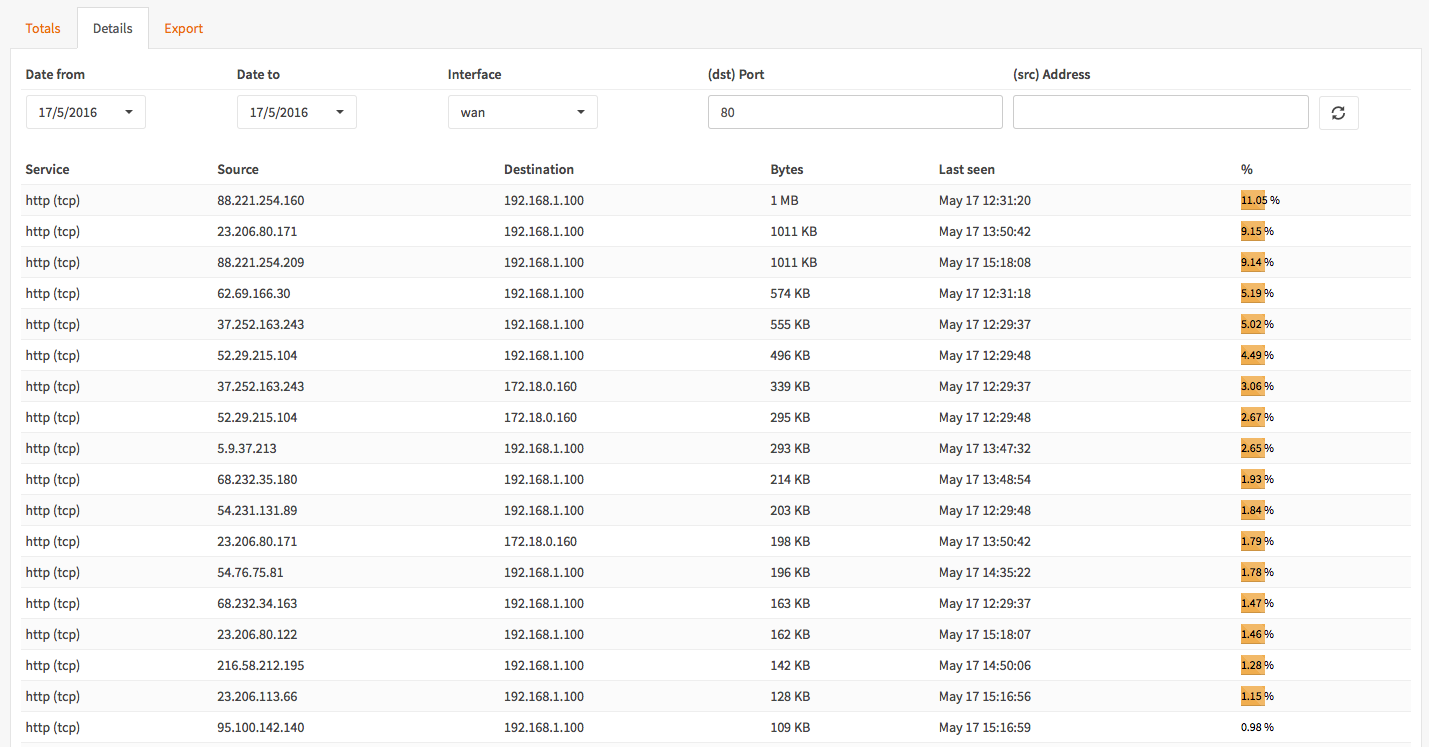
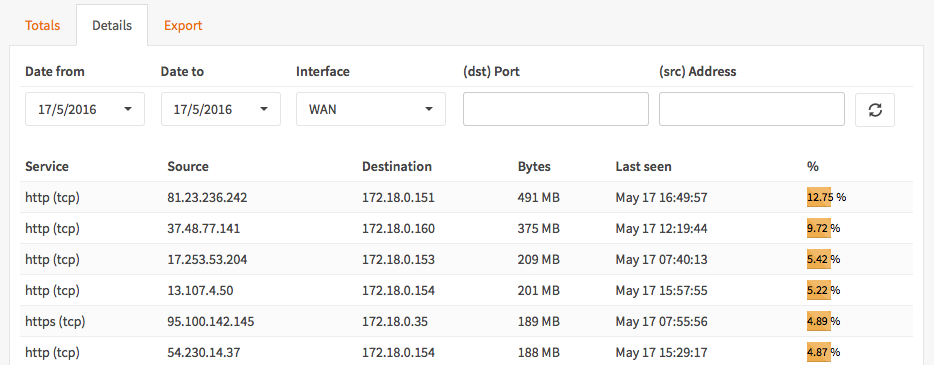
Details View
One can open the details view by clicking on one of the pieces of a pie chart or click on the tab Details.
When opening the details view by clicking on the tab one can make a new query.
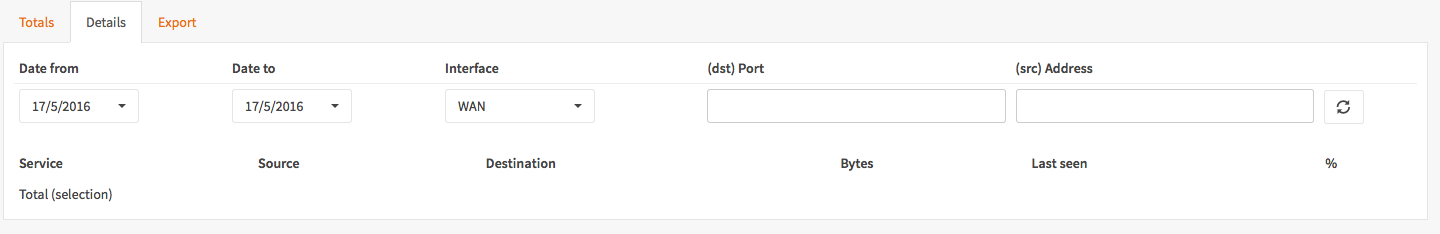
After selecting a valid date range (form/to) and interface one can further limit the output by filtering on port or IP address. Select the refresh icon to update the detailed output. Leave Port and Address empty for a full detailed listing.
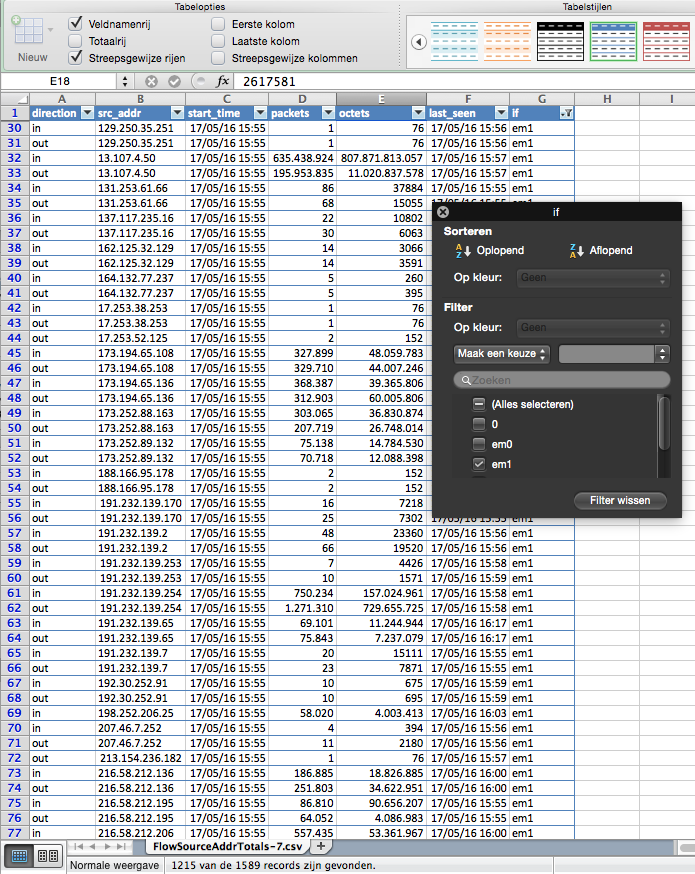
Export View
The Export view allows you to export the data for further analysis in your favorite spreadsheet or other data analysis application.
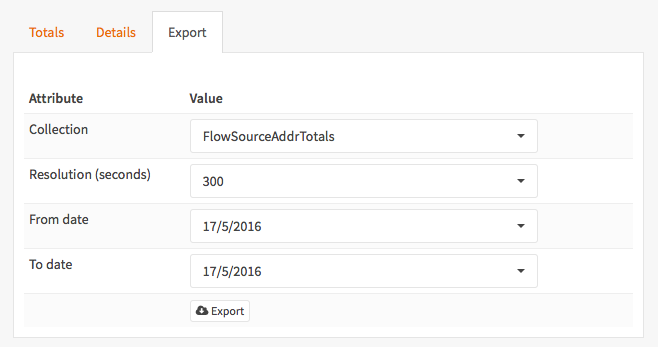
To export data, select a Collection :
FlowSourceAddrTotals - Totals per source address
FlowInterfaceTotals - Totals per interface
FlowDstPortTotals - Totals per destination port
FlowSourceAddrDetails - Full details per source address
Select the Resolution in seconds (300,3600,86400)
Then select a date range (from/to) and click the export button.