System Health & Round Robin Data
System Health is a dynamic view on RRD data gathered by the system. It can be accessed via . It allows you to dive into different statistics that show the overall health and performance of the system over time.
The system health module will enable you to track down issues faster and easier than traditional static RRD graphs and it allows you to zoom in.
Data collectors
System Health has the following primary data collectors:
- Packets
Packets show the number of packets per second traveling to and from a certain interface.
- Quality
Quality show latency and packet loss of the monitored gateways (ip).
- System
The system section is used for sensor data regarding the system utilization, such as memory usage, mbufs, states, processes and (when available) cpu temperature.
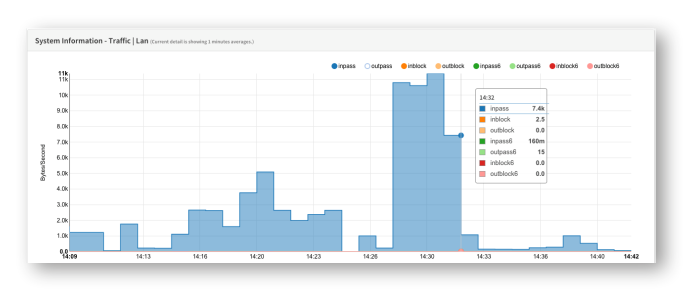
- Traffic
Shows traffic graphs for each interface including vpn (ipsec).
Depending on the features in use there may be more or less graphs available.
GUI Features Overview
Please see the screenshot below for all element of the system health module. Each element will be explained in the next chapters.
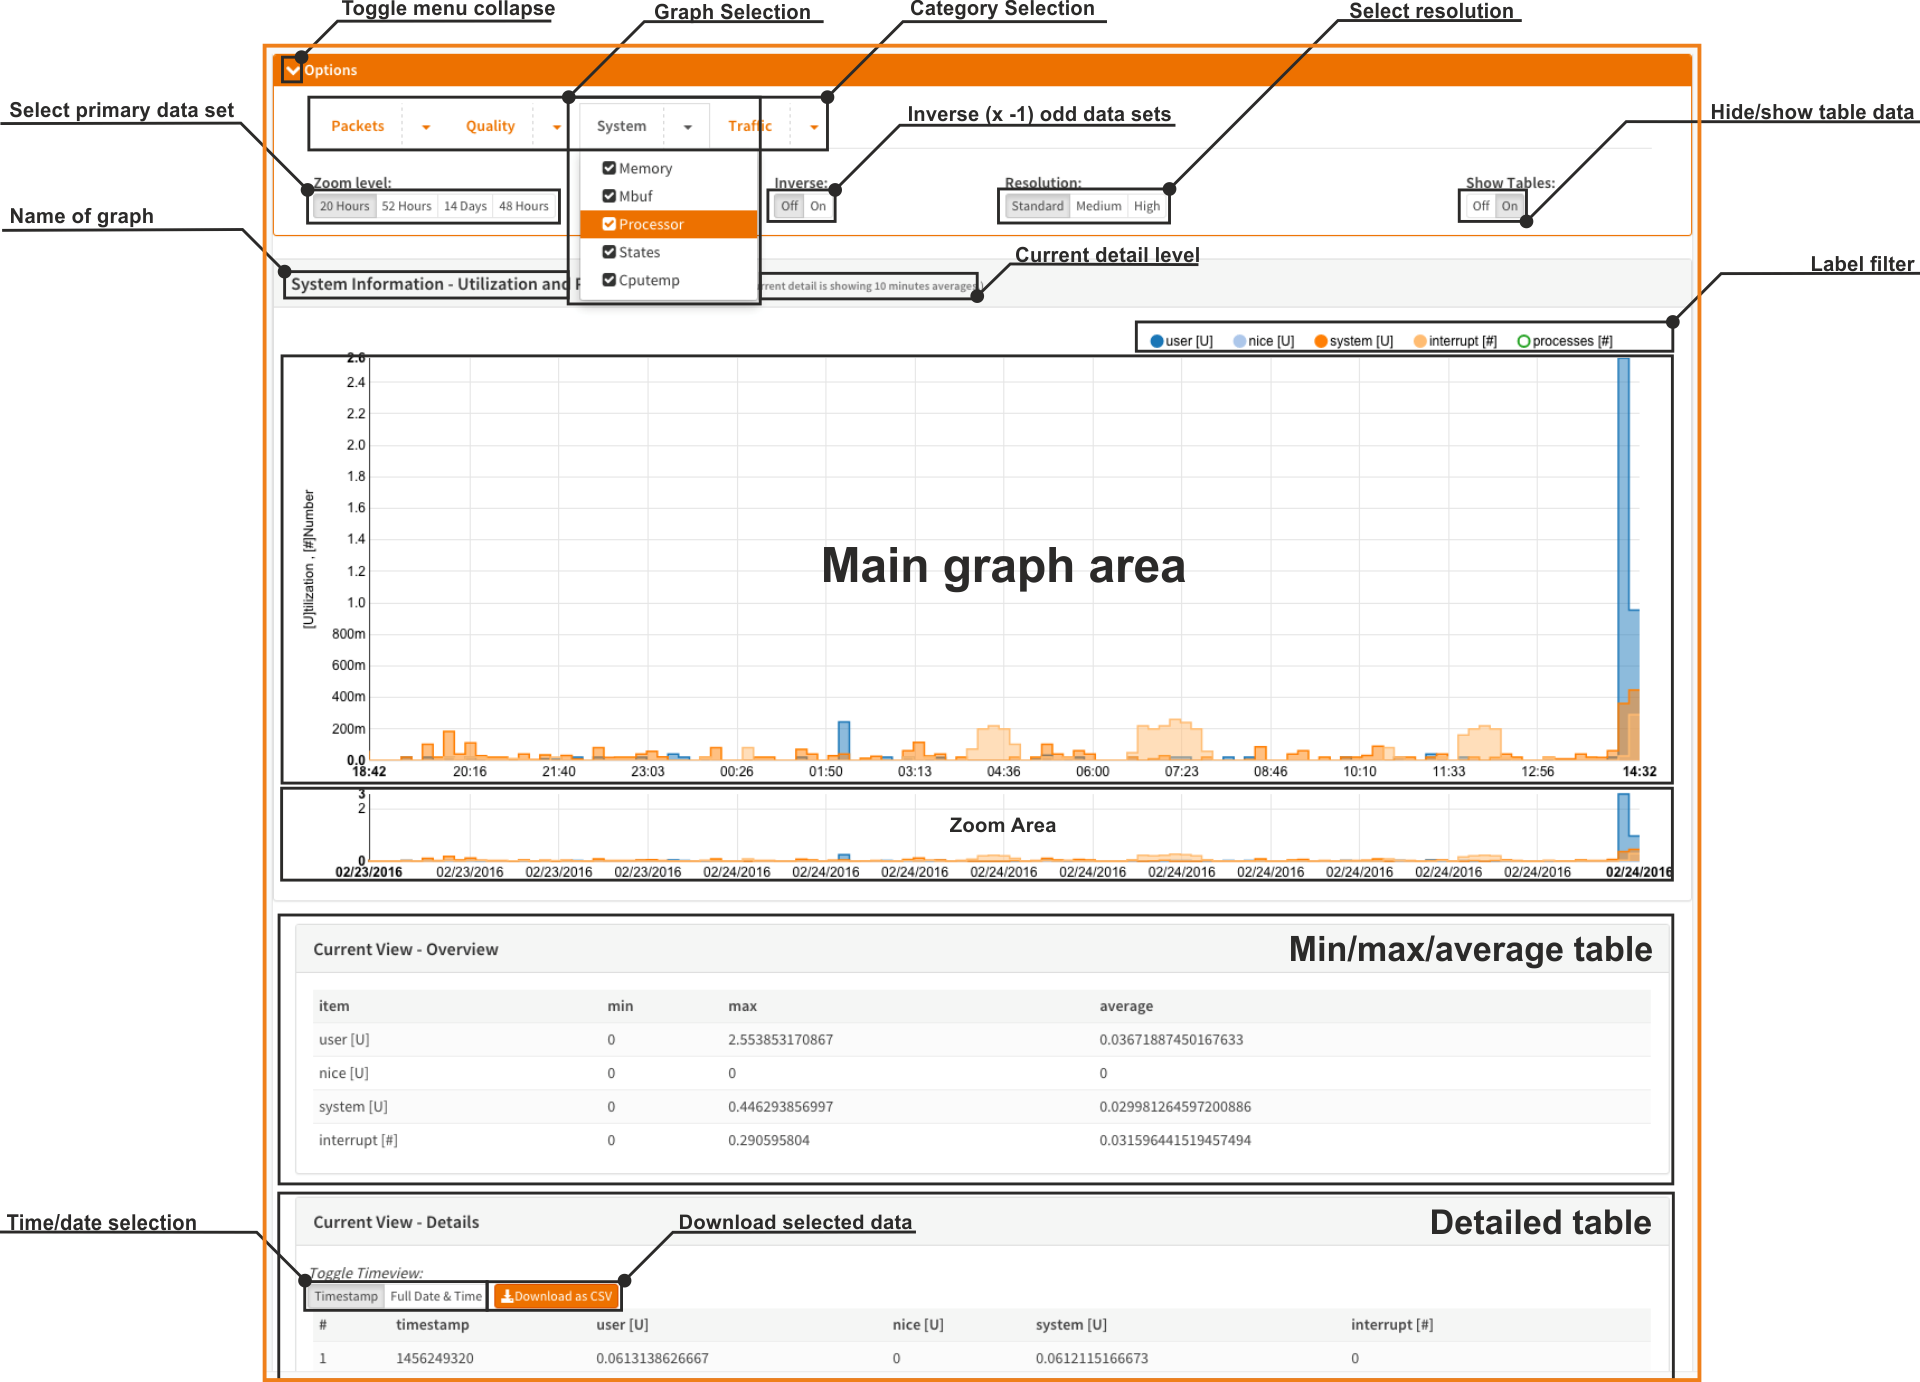
Category Selection
The category items are tabs with drop down menu’s. Click on one of the categories and select the graph you like to dive into.
Graph Selection
Part of the drop down menu, where you can select the graph to view.
Select primary dataset
Select the RRD dataset you want to use. The more to the left the lower the maximum resolution. By default the graphs are opened with the highest available RRD resolution.
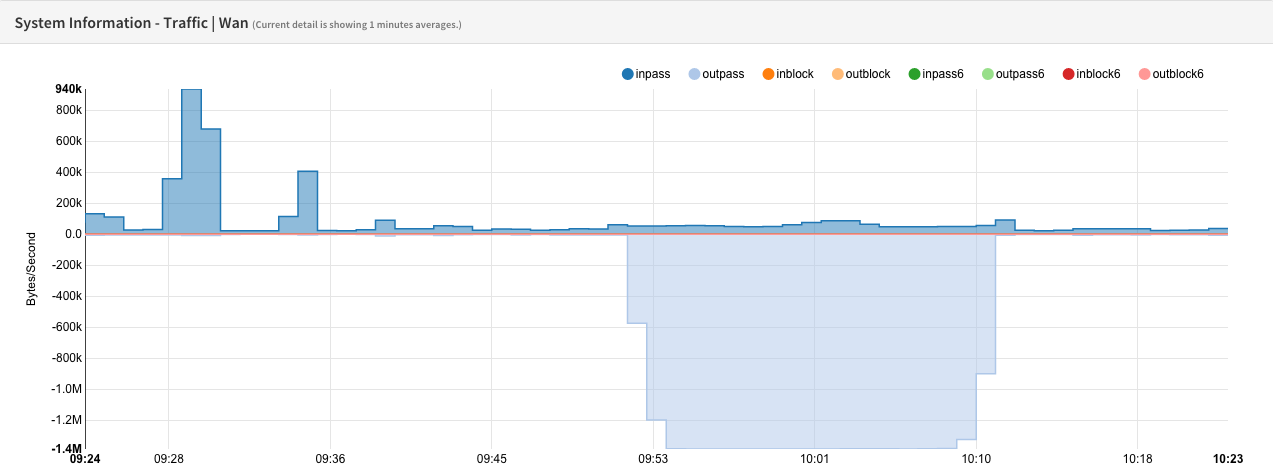
Inverse
By selecting Inverse each odd dataset is reversed in direction (times minus one), this is especially useful for traffic flows where you can plot ingoing and outgoing flows in different directions.
Resolution
The resolution determines the maximum number of datapoints that will be shown in the graph and therefore indirectly influences the scale of the calculated averages.
Hide/show table data
By default the table data is hidden, you can show it by toggling the Show Tables to On.
The table data area consists of the min/max/average and detailed table data area.
Name of the graph
Shows the name of the selected graph.
Current Detail Level
Since the data is dynamically rendered it will automatically calculate the averages and show you the current detail level in this area.
Label filter

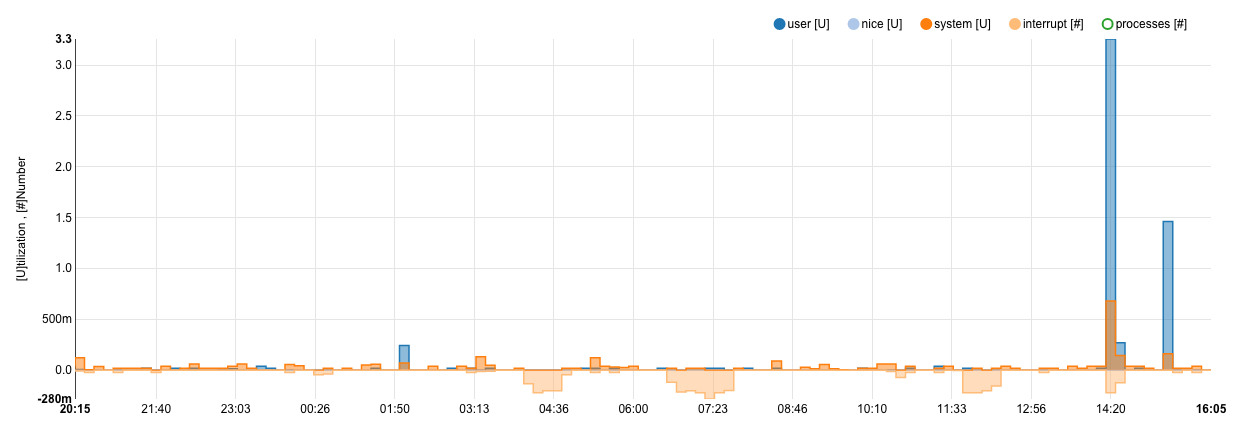
The label filter can be used to filer out data you do not want to see. Click once to disable or double click to select only this set.
A nice sample can be seen here, where the processes obscure all other data.
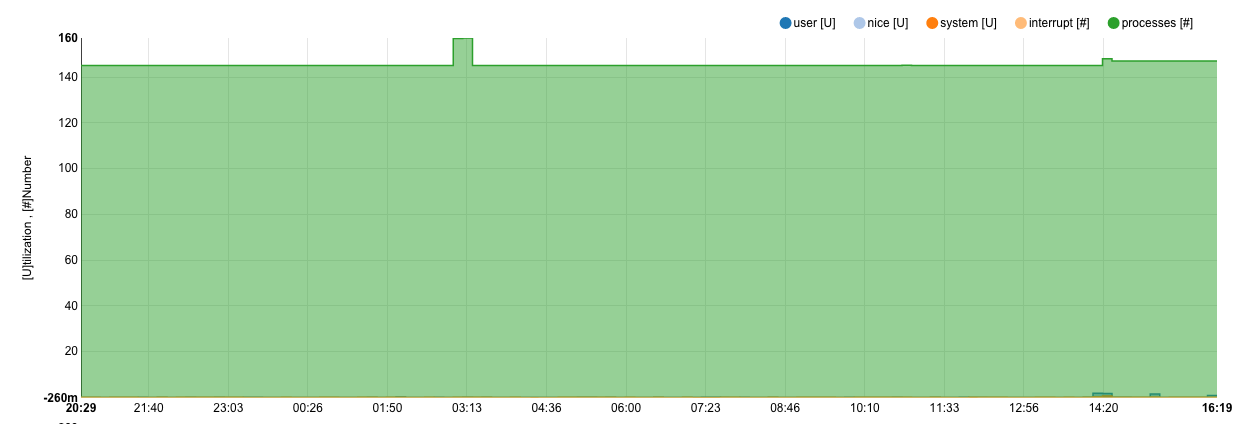
Just click once on processes to hide this data set, notice that the scales will adapt as well.
Main graph area
The main graph area show the full graph or just the part you selected in the zoom area with more detail.
Zoom Area
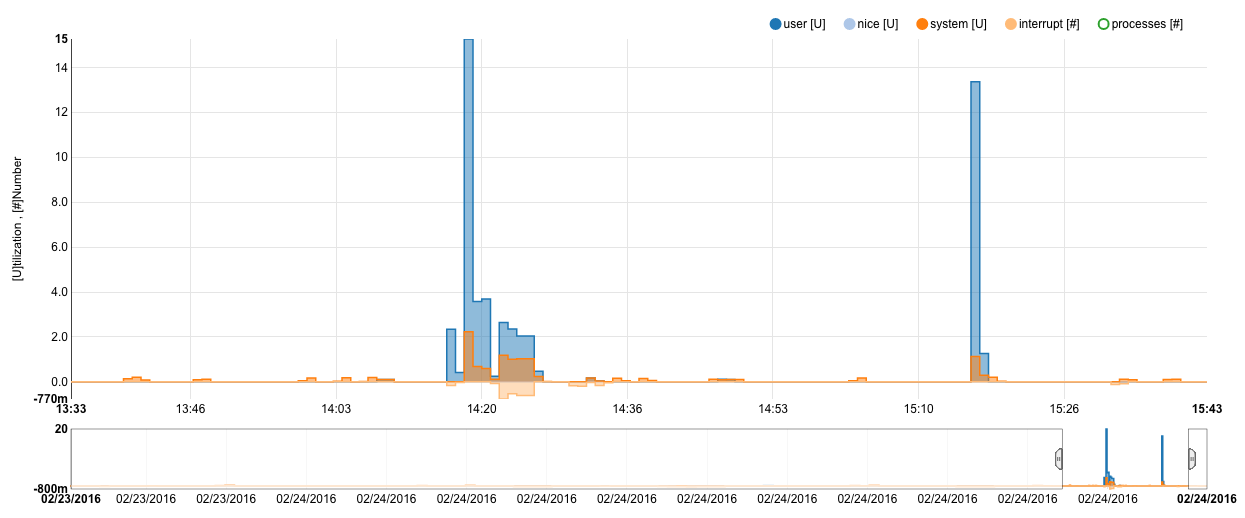
The zoom area can be used to select and zoom in on one part of the graph, the scales are adapted automatically and any tables will be updated as well.
This feature is very useful to zoom in on issues or for showing just part of the graph.
To use, click on it and hold while moving your pointer to another part of the zoom area, on mouse up (release mouse click) the main graph area will be updated accordingly. The zoom area will also be updated with more detailed data - when available - for the selected area.
A sample selection:

And the result:
Min/max/average table
If Show Tables is on then this area will show: * Minimum value of each dataset * Maximum value of each dataset * Average value of each dataset
Detailed table
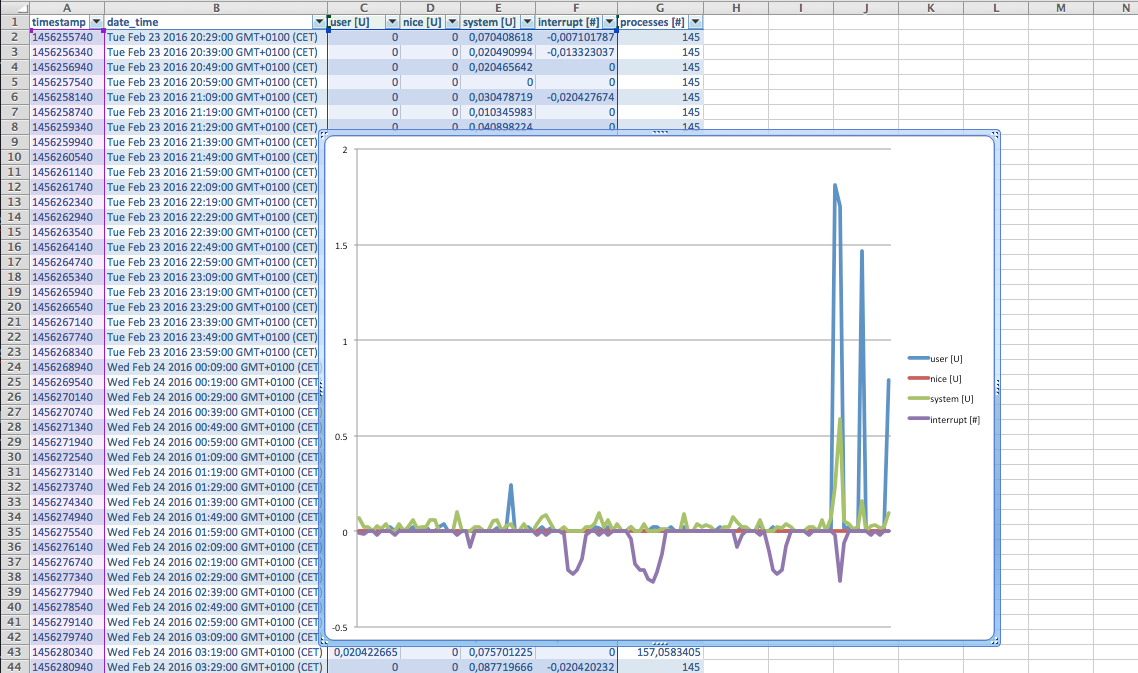
If Show Tables is on then this area will show each value that is plotted in the graph. You can toggle the time and date view from timestamp to human readable values and export the data to as comma separated file (.CSV).
The exported dataset can be used for your own reporting.