Profiling/Debugging the kernel
Overview
Kernel development often involves writing code without an IDE. Even if an IDE is used, proper profiling support is often lacking. Luckily, FreeBSD includes DTrace.
Since OPNsense runs on a fork of FreeBSD, DTrace is natively available on the system for developers to use in debugging and profiling. To quote the FreeBSD handbook on DTrace:
“DTrace, also known as Dynamic Tracing, was developed by Sun™ as a tool
for locating performance bottlenecks in production and pre-production
systems. In addition to diagnosing performance problems, DTrace can be used
to help investigate and debug unexpected behavior in both the FreeBSD kernel
and in userland programs.

DTrace is a remarkable profiling tool, with an impressive array of features
for diagnosing system issues. It may also be used to run pre-written scripts
to take advantage of its capabilities. Users can author their own utilities
using the DTrace D Language, allowing them to customize their profiling based
on specific needs.”
We will be looking at setting up DTrace on OPNsense, and running a sample script to perform some useful analysis on kernel space. An example for generating a FlameGraph will also be presented. Keep in mind that user space can also be analyzed using DTrace, but this is beyond the scope of this document.
Although detailed steps for enabling DTrace in a custom kernel are widely available, this document provides an explanation in combination with the use of OPNsense-specific tools. Further resources will be provided at the end of this document.
Note
All generic DTrace concepts, as well as default probe providers are documented here. If you are interested in using DTrace to profile performance issues, we suggest reading the documentation before proceeding. We will not go into too much detail here to prevent cluttering the document and keep it simple and to-the-point.
Enabling DTrace
Make sure the OPNsense/src repository is present on the system and navigate to
/usr/src/sys/[ARCHITECTURE, e.g. amd64]/conf and open up GENERIC.
Add the following options:
makeoptions     DEBUG=-g                # Will build a debug kernel (using gdb debug symbols)
makeoptions     WITH_CTF=1              # Adds CTF type data to built executables
options         KDTRACE_FRAME           # Ensure frames are compiled in
Note
CTF type data is described here. The idea is to represent the types used in a C program within the executable, allowing users of DTrace to access symbols and function parameters during runtime.
As a best practice, under stock FreeBSD you would save the file under a different name
(e.g. DTRACE) and build the kernel by specifying KERNCONF=DTRACE.
The opnsense-tools require the name to be GENERIC, so we will leave it as is.
It is advisable to create a backup of the original GENERIC file though.
Make sure the OPNsense-tools repository is installed and navigate to /usr/tools/config/[VERSION].
Open up SMP and make sure the following line is either removed or commented out:
nomakeoptions DEBUG
Furthermore, should you wish to enable DTrace in Userspace, it is imperative that you also
add the following line to /usr/tools/conf/[VERSION]/make.conf
STRIP=
CFLAGS+=-fno-omit-frame-pointer
Now clean and build the new kernel
# make clean-obj,kernel kernel
A kernel package will be available at the following location:
/usr/local/opnsense/build/[Version]/[Architecture]/sets/kernel*.txz
Install the package using our opnsense-update command:
# opnsense-update -ikfr [version] -l /location/from/
Where [version] is the version part of the kernel package, such as 21.1.a_83
DTrace program
Although it is possible to instruct DTrace to execute a certain function on the command line (and there are a lot of one-liners for this here), instead we present a D script that measures some statistics on the ixgbe 10GbE driver and shows some interesting capabilities of DTrace in one go. Specifically, it measures the amount of interrupts fired on the packet receive side, as well as the time spent in the relevant functions in nanoseconds. It also measures how many threads on average are waiting to be serviced because another thread is busy.
/* RX threads, retrieved from procstat -a -t, listing thread information for all (kernel) processes */
inline int	qg0 = 100018;
inline int	qg1 = 100019;
inline int 	qg2 = 100020;
inline int	qg3 = 100021;
inline int	qg4 = 100022;
inline int	qg5 = 100023;
inline int	qg6 = 100024;
inline int 	qg7 = 100025;

/* Because of this preprocessor statement, this script should be compiled with -C option */
#define PROBE_PREDICATE 		\
			pid == 0 &&	\
			(tid == qg0 || 	\
			 tid == qg1 || 	\
			 tid == qg2 || 	\
			 tid == qg3 || 	\
			 tid == qg4 || 	\
			 tid == qg5 || 	\
			 tid == qg6 || 	\
			 tid == qg7)	\
					\


#define DRIVER_CHECK self->driver_prefix == "ix"

/********************************************/
/* Iflib rx info & interrupt info */
/********************************************/

struct iflib_intr_info {
	uint64_t fast_intr_ts;
	uint64_t fast_intr_elapsed;
	uint64_t filter_routine_ts;
	uint64_t task_tx_ts;
};

struct iflib_intr_info ii[int];

struct iflib_task_info {
	uint64_t task_rx_ts;
	uint64_t rxeof_ts;
};

struct iflib_task_info iti[int];

/* RX (and TX) interrupt entry point, will call driver supplied filter */
fbt::iflib_fast_intr:entry
{
	ii[tid].fast_intr_ts = timestamp;
	this->info = ((kernel`iflib_filter_info_t)arg0);
	self->rxq_id = (uint16_t)((kernel`iflib_rxq_t)this->info->ifi_ctx)->ifr_id;
	@intcounts[tid, self->rxq_id, probefunc] = count();

}

fbt::iflib_fast_intr:return
/ii[tid].fast_intr_ts/
{
	@time[tid, self->rxq_id, probefunc] = avg(timestamp - ii[tid].fast_intr_ts);
	@fi_time_min[tid, self->rxq_id, probefunc] = min(timestamp - ii[tid].fast_intr_ts);
	@fi_time_max[tid, self->rxq_id, probefunc] = max(timestamp - ii[tid].fast_intr_ts);
}

/* axgbe driver filter routine */
fbt::axgbe_msix_que:entry, fbt::ixgbe_msix_que:entry
{
	ii[tid].filter_routine_ts = timestamp;
	@intcounts[tid, self->rxq_id, probefunc] = count();
}

fbt::axgbe_msix_que:return, fbt::ixgbe_msix_que:return
/ii[tid].filter_routine_ts/
{
	@fr_time_avg[tid, self->rxq_id, probefunc] = avg(timestamp - ii[tid].filter_routine_ts);
	@fr_time_min[tid, self->rxq_id, probefunc] = min(timestamp - ii[tid].filter_routine_ts);
	@fr_time_max[tid, self->rxq_id, probefunc] = max(timestamp - ii[tid].filter_routine_ts);
}


/*
 * at this point, iflib has enqueued the _task_fn_rx / _task_fn_tx function,
 * we could measure some relevant things here.
 * The threads that run the queued functions are all in the range of the threads
 * defined at the top of this file
 * We could also inspect the queue structure to determine the average amount of functions
 * waiting to be serviced, this information could be pulled out of the iflib interrupt handler
 * Also, the thread that runs the queued function is different from the thread that runs the interrupt handler,
 * so query again for the relevant drivers and include it in the probe predicates
 */

char *driver_name[2];


fbt::_task_fn_rx:entry
/PROBE_PREDICATE && (!self->prefix_set)/
{


	/* get taskqueue structure information to determine amount of functions waiting to be serviced */
	this->rxq = ((kernel`iflib_rxq_t)arg0);
	this->grouptask = (struct grouptask)(this->rxq->ifr_task);
	self->gt_name = stringof(this->grouptask.gt_name);
	this->if_ctx = (if_ctx_t)(this->rxq)->ifr_ctx;
	this->dev = (device_t)(this->if_ctx)->ifc_dev;
	this->driver = (driver_t *)(this->dev)->driver;
	driver_name[0] = (const char *)(this->driver)->name;
	driver_name[1] = (const char *)(this->driver)->name + 1;
	self->driver_prefix = stringof(*(driver_name));
	self->prefix_set = 1;

}

fbt::_task_fn_rx:entry
/PROBE_PREDICATE && DRIVER_CHECK/
{
	iti[tid].task_rx_ts = timestamp;
	@_task_fn_rx_count[tid, self->gt_name, probefunc] = count();
}

fbt::_task_fn_rx:return
/PROBE_PREDICATE && iti[tid].task_rx_ts && DRIVER_CHECK/
{
	@task_rx_avg[tid, self->gt_name, probefunc] = avg(timestamp - iti[tid].task_rx_ts);
	@task_rx_min[tid, self->gt_name, probefunc] = min(timestamp - iti[tid].task_rx_ts);
	@task_rx_max[tid, self->gt_name, probefunc] = max(timestamp - iti[tid].task_rx_ts);
}


fbt::iflib_rxeof:entry
/PROBE_PREDICATE && DRIVER_CHECK/
{
	iti[tid].rxeof_ts = timestamp;
	@rxeof_count[tid, self->gt_name, probefunc] = count();

}

fbt::iflib_rxeof:return
/PROBE_PREDICATE && iti[tid].rxeof_ts && DRIVER_CHECK/
{
	@rxeof_avg[tid, self->gt_name, probefunc] = avg(timestamp - iti[tid].rxeof_ts);
	@rxeof_min[tid, self->gt_name, probefunc] = min(timestamp - iti[tid].rxeof_ts);
	@rxeof_max[tid, self->gt_name, probefunc] = max(timestamp - iti[tid].rxeof_ts);

}

fbt::ixgbe_isc_rxd_refill:entry
/PROBE_PREDICATE && DRIVER_CHECK/
{
	this->ts = timestamp;
	@rxd_refill_count[tid, self->gt_name, probefunc] = count();
}

fbt::ixgbe_isc_rxd_refill:return
/PROBE_PREDICATE && this->ts && DRIVER_CHECK/
{

	@rxd_refill_avg[tid, self->gt_name, probefunc] = avg(timestamp - this->ts);
	@rxd_refill_min[tid, self->gt_name, probefunc] = min(timestamp - this->ts);
	@rxd_refill_max[tid, self->gt_name, probefunc] = max(timestamp - this->ts);
}


/* notice how the ixgbe driver is missing, this is because of the dtrace compiler optimization - the return probe is missing */
fbt::ixgbe_isc_rxd_available:entry
/PROBE_PREDICATE && DRIVER_CHECK/
{
	this->ts = timestamp;
	@rxd_avail_count[tid, self->gt_name, probefunc] = count();
}

fbt::ixgbe_isc_rxd_available:return
/PROBE_PREDICATE && (this->ts != 0) && DRIVER_CHECK/
{
	@rxd_avail_avg[tid, self->gt_name, probefunc] = avg(timestamp - this->ts);
	@rxd_avail_min[tid, self->gt_name, probefunc] = min(timestamp - this->ts);
	@rxd_avail_max[tid, self->gt_name, probefunc] = max(timestamp - this->ts);
}

fbt::ixgbe_isc_rxd_pkt_get:entry
/PROBE_PREDICATE && DRIVER_CHECK/
{
	this->ts = timestamp;
	@rxd_pkt_get_count[tid, self->gt_name, probefunc] = count();
}

fbt::ixgbe_isc_rxd_pkt_get:return
/PROBE_PREDICATE && (this->ts != 0) && DRIVER_CHECK/
{
	@rxd_pkt_get_avg[tid, self->gt_name, probefunc] = avg(timestamp - this->ts);
	@rxd_pkt_get_min[tid, self->gt_name, probefunc] = min(timestamp - this->ts);
	@rxd_pkt_get_max[tid, self->gt_name, probefunc] = max(timestamp - this->ts);
}


/********************************************/
/* Queue behaviour */
/********************************************/

int qlen[int];

/* enqueue and deqeueue probes to determine the run length of the queues */
sched:::enqueue
/PROBE_PREDICATE && DRIVER_CHECK/
{
	this->q_len = qlen[tid]++;

	@q_len_all_threads_avg[tid] = avg(this->q_len);
	@q_len_all_threads_min[tid] = min(this->q_len);
	@q_len_all_threads_max[tid] = max(this->q_len);
}

sched:::dequeue
/PROBE_PREDICATE && qlen[tid] && DRIVER_CHECK/
{
	qlen[tid]--;

}


END
{
	printf("\n");
	printf("\n");
	printf("\n");
	printf("\n");
	printf("-------INTERRUPTS-------\n");
	printf("\n");
	printf("thread  core               function            count  avg time(ns)  min time  max time  avg time(driver)  min time(driver)  max time(driver)\n");
	printf("------  ----  ---------------------  ---------------  ------------  --------  --------  ----------------  ----------------  ----------------\n");
	printa("%6d  %4d  %21s  %@15d  %@12d  %@8d  %@8d  %@16d  %@16d  %@16d\n", @intcounts, @time, @fi_time_min, @fi_time_max, @fr_time_avg, @fr_time_min, @fr_time_max);
	printf("\n");

	printf("-------DRIVER/IFLIB FUNCTIONS RX-------\n");
	printf("thread  grouptask name                        function  avg time(ns)  min time(ns)  max time(ns)        count\n");
	printf("------  --------------  ------------------------------  ------------  ------------  ------------  -----------\n");
	printa("%6d  %14s  %30s  %@12d  %@12d  %@12d  %@11d\n", @task_rx_avg, @task_rx_min, @task_rx_max, @_task_fn_rx_count);
	printa("%6d  %14s  %30s  %@12d  %@12d  %@12d  %@11d\n", @rxeof_avg, @rxeof_min, @rxeof_max, @rxeof_count);
	printa("%6d  %14s  %30s  %@12d  %@12d  %@12d  %@11d\n", @rxd_refill_avg, @rxd_refill_min, @rxd_refill_max, @rxd_refill_count);
	printa("%6d  %14s  %30s  %@12d  %@12d  %@12d  %@11d\n", @rxd_avail_avg, @rxd_avail_min, @rxd_avail_max, @rxd_avail_count);
	printa("%6d  %14s  %30s  %@12d  %@12d  %@12d  %@11d\n", @rxd_pkt_get_avg, @rxd_pkt_get_min, @rxd_pkt_get_max, @rxd_pkt_get_count);
	printf("\n");


	printf("---------QUEUE BEHAVIOUR---------\n");
	printf("thread  avg run length  min run length  max run length\n");
	printf("------  --------------  --------------  --------------\n");
	printa("%6d  %@14d  %@14d  %@14d\n", @q_len_all_threads_avg, @q_len_all_threads_min, @q_len_all_threads_max);
	printf("\n");
}
The one-line command to pre-process, compile and run the script is:
# dtrace -C -s example.d
The -C option specifies that the standard C preprocessor should evaluate the file, ensuring
that the C-specific code like macro definitions are defined.
The output (when pinging the device):
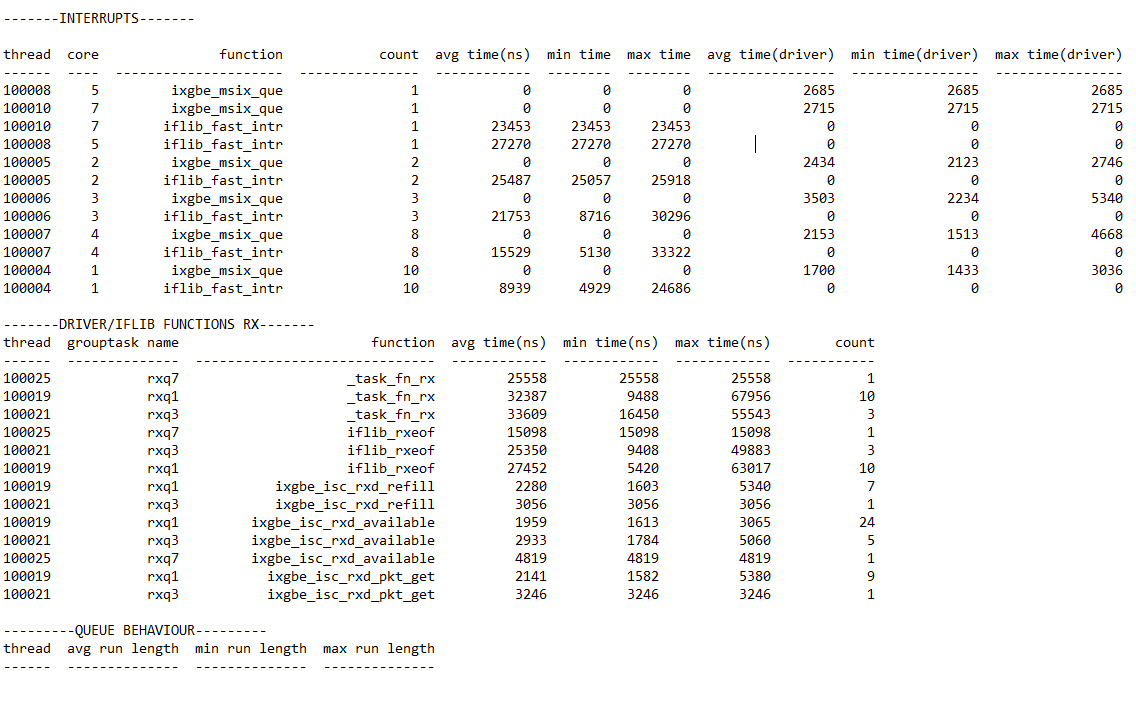
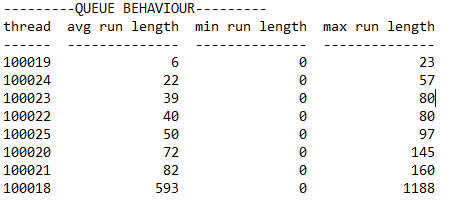
Notice how the queue behaviour section shows no output, this is because there is no actual queue behaviour going on. There is simply too little traffic for the kernel to be queueing threads. When stressing the driver, it might look something like this:
Flame Graphs
If you run the following command:
# dtrace -n 'uiomove:entry{ @[stack()] = count(); }'
Let it run for a while, and exit using CTRL-C
You will see all stack frames associated with
uiomove() that have taken place, aggregated to only unique frames. The number below the individual
frame represents the amount of times that particular frame was executed. Although this is nice,
it isn’t particularly visually pleasing or helpful in spotting potential bottlenecks.
A senior performance analyst at Netflix, named Brendan Gregg, developed the FlameGraph for use with DTrace (and other profiling tools). The program consists of a set of Perl files that take in the data produced by a command similar to the one we executed, and generate a graph that helps spot ‘hot code paths’. This time however, we will look at the kernel as a whole and sample it in a set interval.
1. Clone the repository and instruct dtrace to sample kernel stacks at a rate of 997 Hertz for 60 seconds:
# dtrace -x stackframes=100 -n 'profile-997 /arg0/ { @[stack()] = count(); } tick-60s { exit(0); }' -o out.kern_stacks
Collapse the individual lines in the output file by folding it into single lines:
# ./stackcollapse.pl out.kern_stacks > out.kern_folded
Having a separate folded input file allows for grepping functions of interest:
# grep cpuid out.kern_folded | ./flamegraph.pl > cpuid.svg
Note
If you get the message “Command not found”, use the command
perl stackcollapse.pl out.kern_stacks > out.kern_folded
Generate a flame graph:
# ./flamegraph.pl out.kern_folded > kernel.svg

The output image is an SVG file, enabling interaction within a browser.
Other Resources
Brendan Gregg’s collection of DTrace programs: http://www.brendangregg.com/dtrace.html
Using the right datatypes in DTrace to increase profiling performance: http://dtrace.org/blogs/brendan/2011/11/25/dtrace-variable-types/
FreeBSD DTrace manual page: https://www.freebsd.org/cgi/man.cgi?query=dtrace
FreeBSD DTrace one-liners: https://wiki.freebsd.org/DTrace/One-Liners